Dashboard
Version: 1.0.1
Route: / (alias /dashboard → /)
Who can access: Users with View on dashboard
What this page does
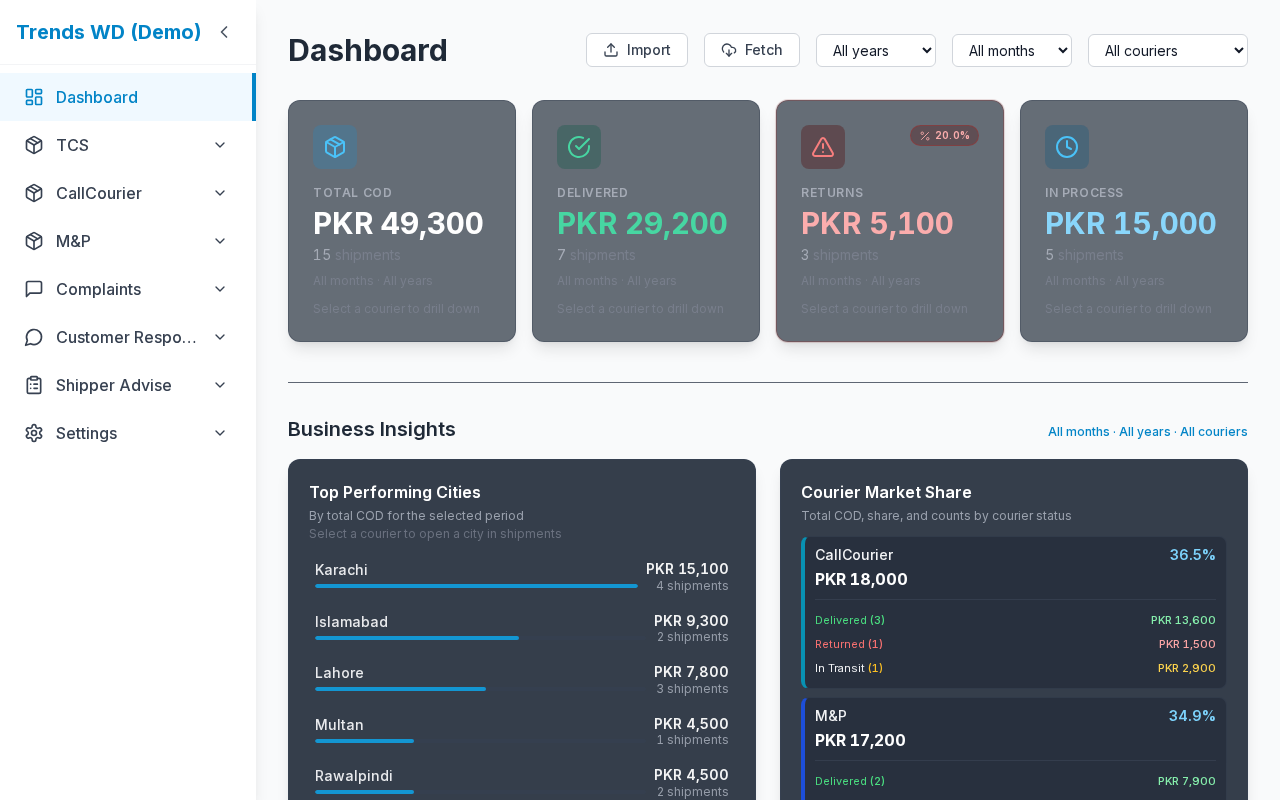
Shows a filtered COD overview: totals, delivered / returned / in-process buckets, and business insights (top cities, courier share). From here you can open Import (if you have COD Edit).
Layout at a glance
| Area | Content |
|---|---|
| Header | Title Dashboard, optional Import, filters Year / Month / Courier |
| Stat cards | TOTAL COD, DELIVERED, RETURNS, IN PROCESS (labels as shown in UI) |
| Business Insights | Top performing cities, courier market share |
Steps
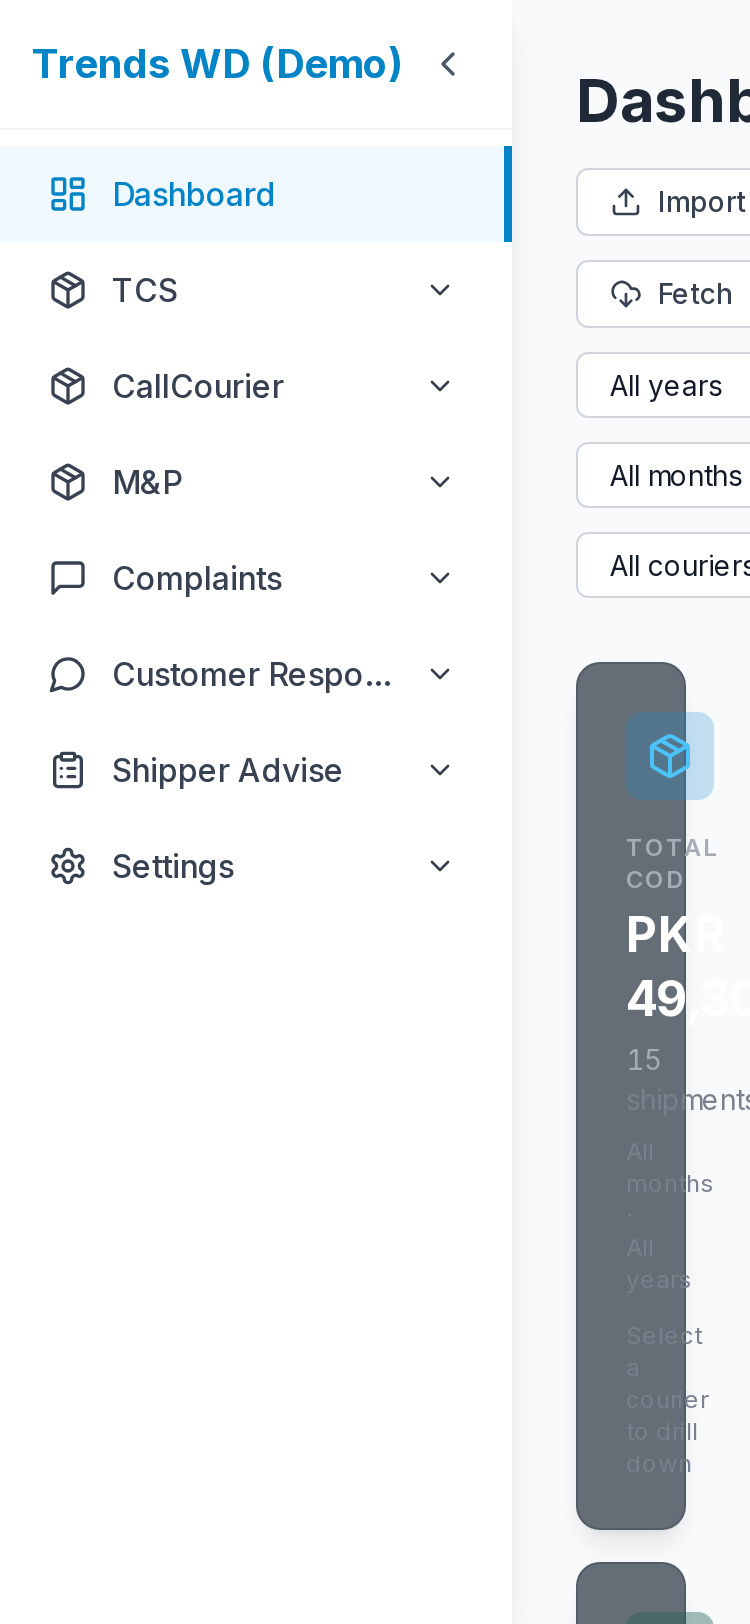
- Sign in and open Dashboard in the sidebar (or
/). - Set Year, then Month, then Courier (optional) in the top-right filters.
- Read the four summary cards for counts and COD amounts (PKR).
- Scroll to Business Insights for city bars and courier share.
- (Optional) Click Import if you have COD Edit — opens the multi-courier CSV import modal.
- Drill into a courier from insights or the sidebar for shipment detail.
Filters
| Control | Effect |
|---|---|
| Year | Limit stats to that year or all years |
| Month | Limit to a month or all months |
| Courier | All couriers or one courier |
Changing a filter reloads cards and charts.
Permissions
| Action | Need |
|---|---|
| View dashboard | dashboard View |
| Import button | all-courier Edit |
Errors & edge cases
| Situation | Notes |
|---|---|
| Empty / zero stats | No shipments in range, or (Demo) not logged in / clear localStorage and re-login |
| No couriers | Insights may show empty courier share — add couriers in Courier Setup |